

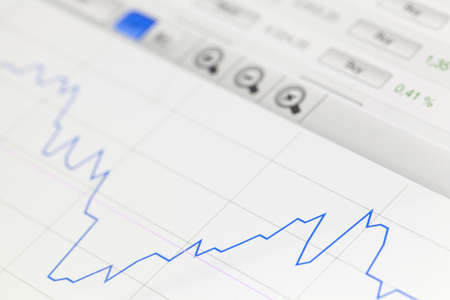
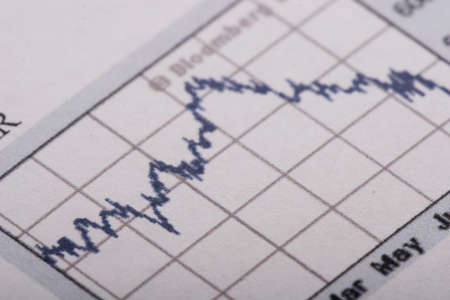
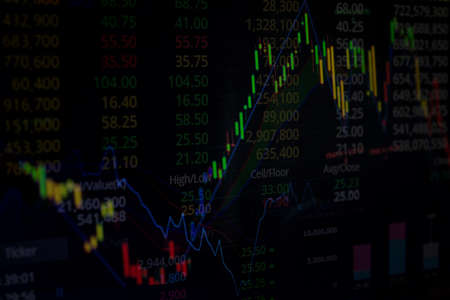
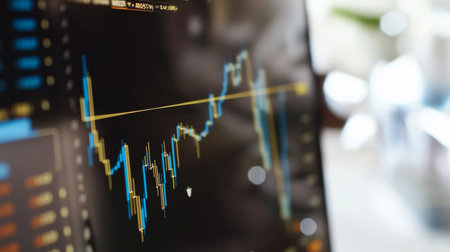
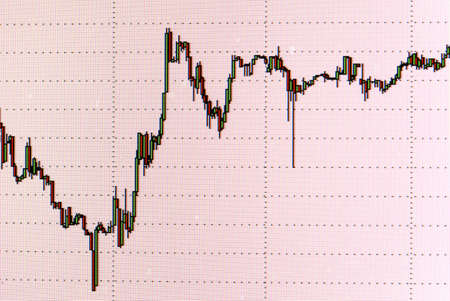
image is a graph of financial development on a computer monitor.
Коллекция по умолчанию
Коллекция по умолчанию
Создать новую
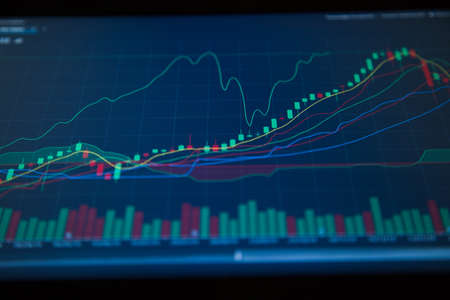
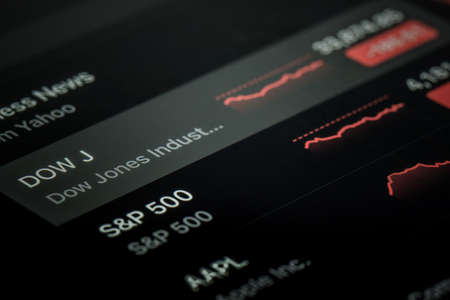
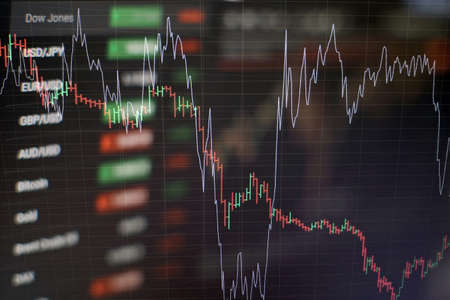
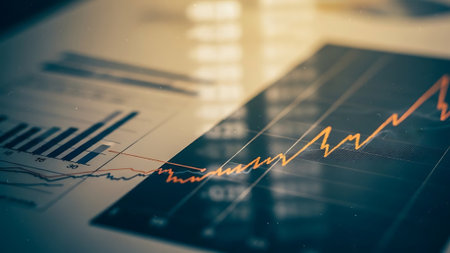
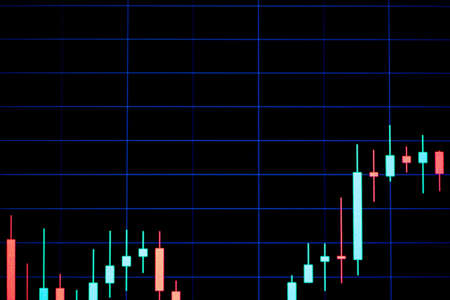
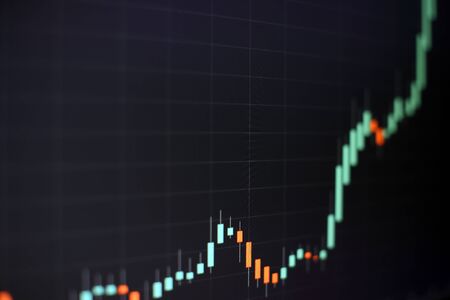
Stock Market Trading Chart Investment Analysis Business Index Chart Finance Board Chart
Коллекция по умолчанию
Коллекция по умолчанию
Создать новую

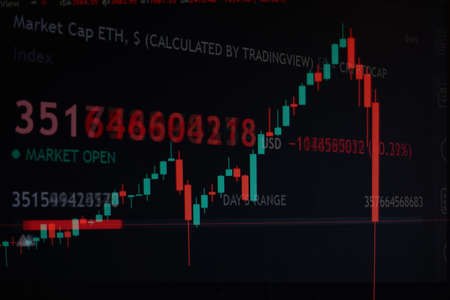
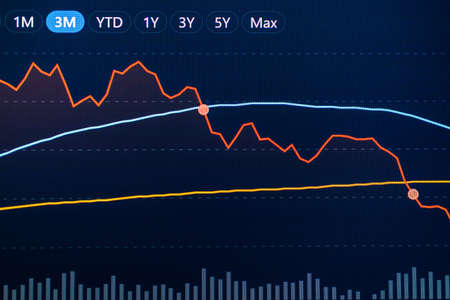
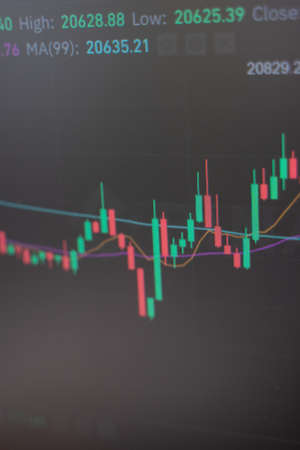
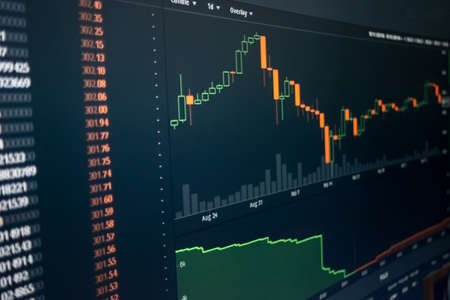
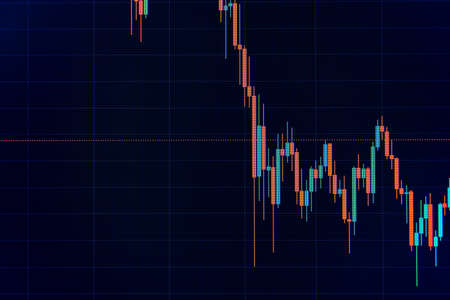
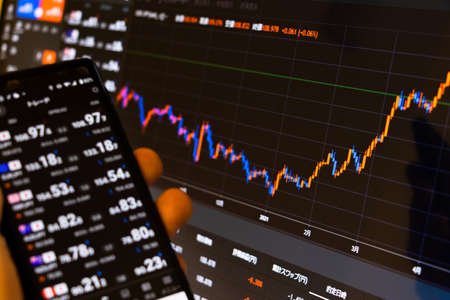
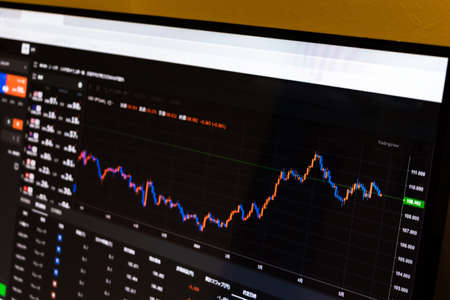
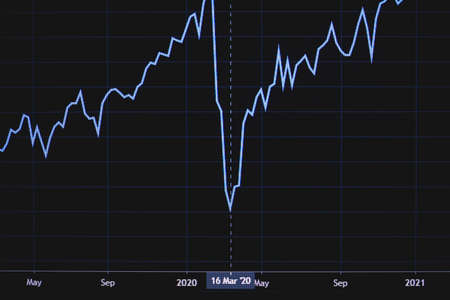
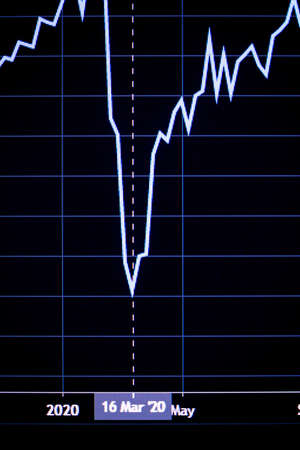
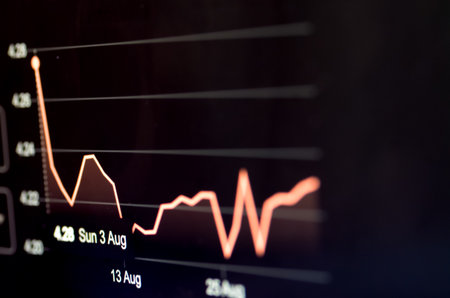
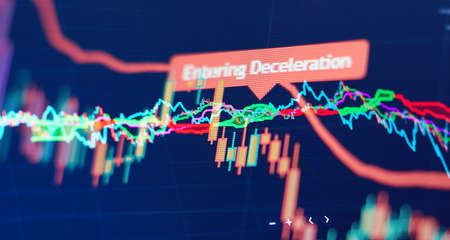
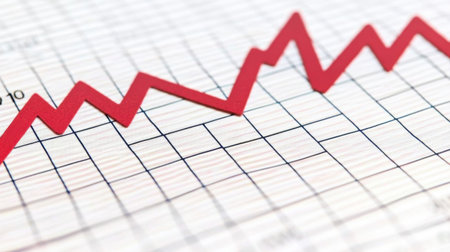
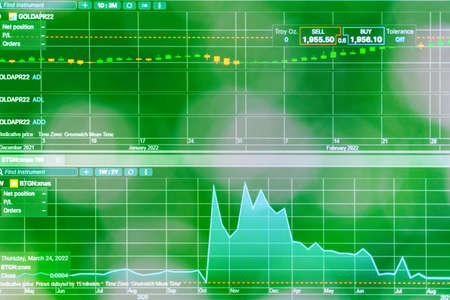
Shallow depth of field (selective focus) with details of a chart showing the stock market crash from March 2020 due to the Covid-19 pandemic on a computer screen (S&P500 index)
Коллекция по умолчанию
Коллекция по умолчанию
Создать новую
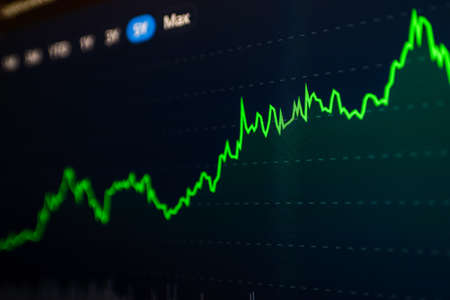
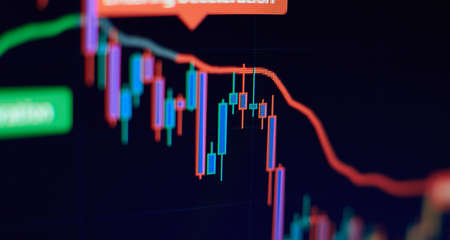
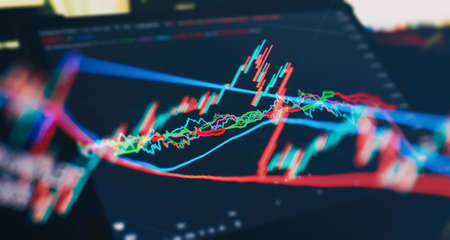
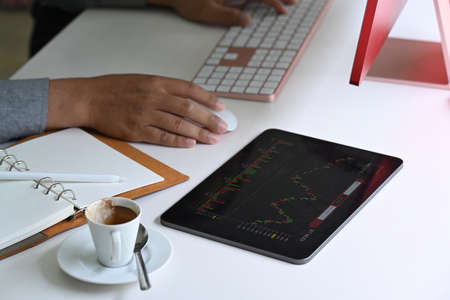
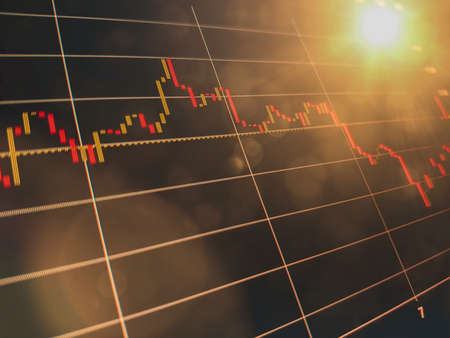
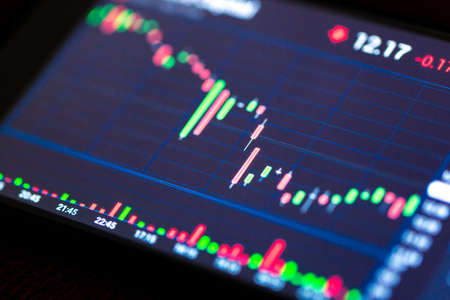
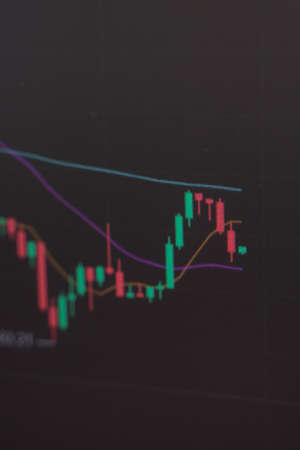
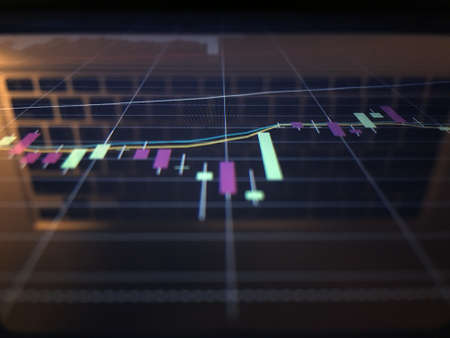
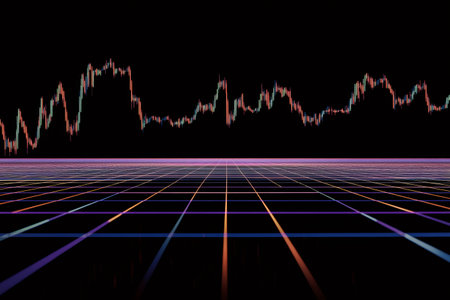
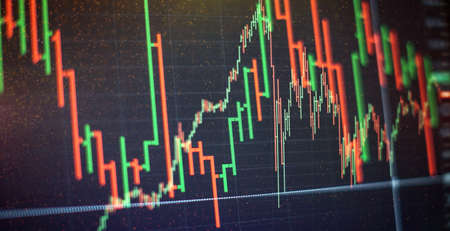
Grow Stock market trading graph in graphic concept.financial investment or economic trends business design. Abstract finance background.Low angle shot.
Коллекция по умолчанию
Коллекция по умолчанию
Создать новую
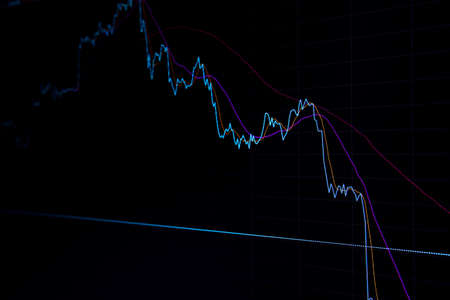
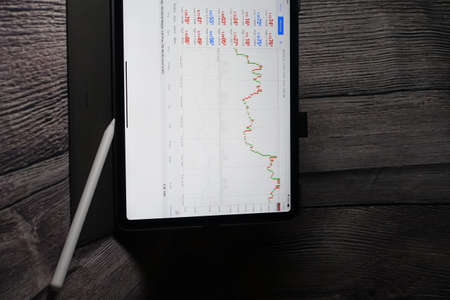
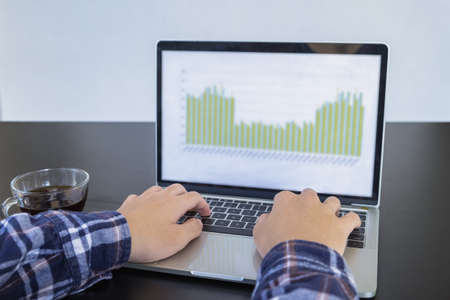
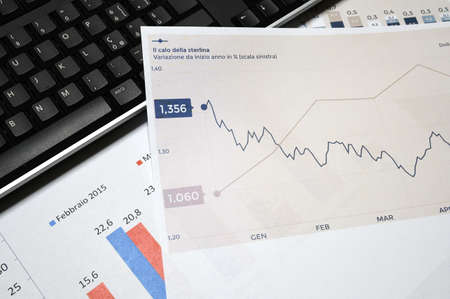
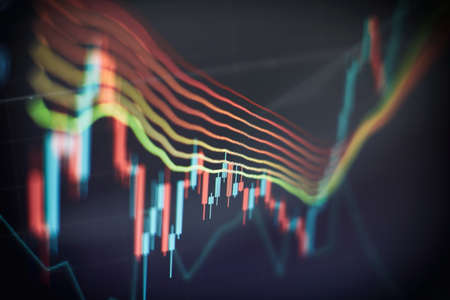
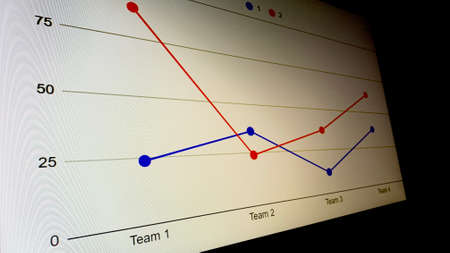
securities price chart on the monitor screen
Коллекция по умолчанию
Коллекция по умолчанию
Создать новую
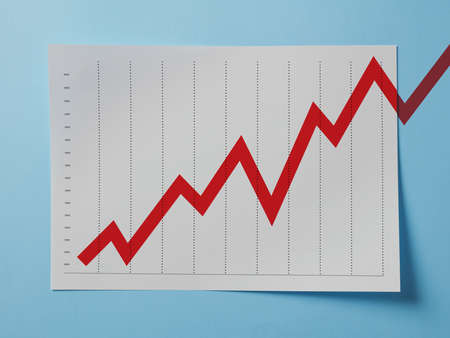
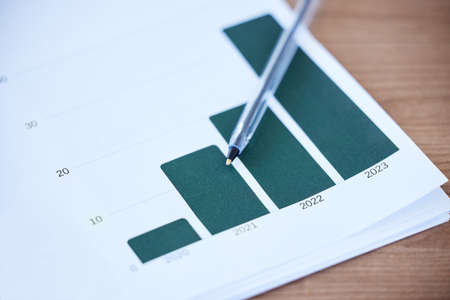
Growing chart on A4 page on blue background
Коллекция по умолчанию
Коллекция по умолчанию
Создать новую
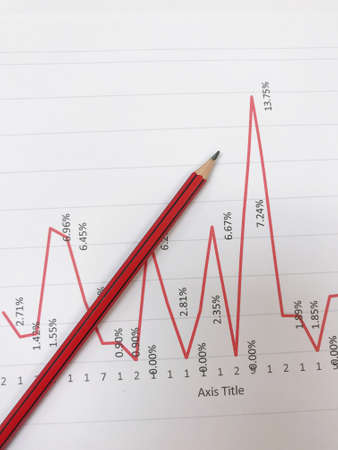
Financial graphic chart
Коллекция по умолчанию
Коллекция по умолчанию
Создать новую

image of the financial graph on a computer monitor.
Коллекция по умолчанию
Коллекция по умолчанию
Создать новую
Stock market trading graph in graphic concept.financial investment or economic trends business design. Abstract finance background.Low angle shot.
Коллекция по умолчанию
Коллекция по умолчанию
Создать новую
Stock or business market analysis concept. Business financial or stock market background.
Коллекция по умолчанию
Коллекция по умолчанию
Создать новую
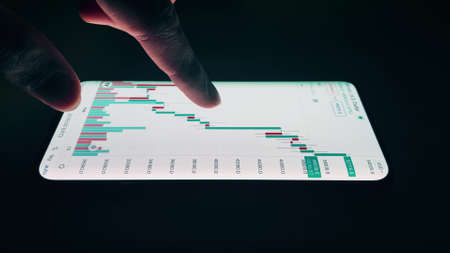
Tablet Index, Exchange Trading Forex Finance Graphic Concept
Коллекция по умолчанию
Коллекция по умолчанию
Создать новую

Statistical financial graph predicting an economic depression after a 2020 global coronavirus pandemic.
Коллекция по умолчанию
Коллекция по умолчанию
Создать новую
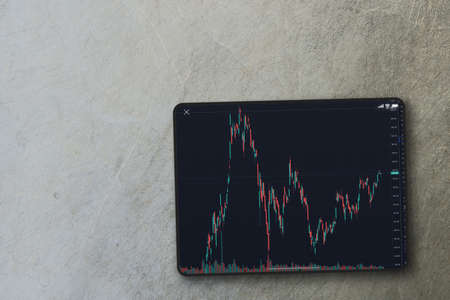
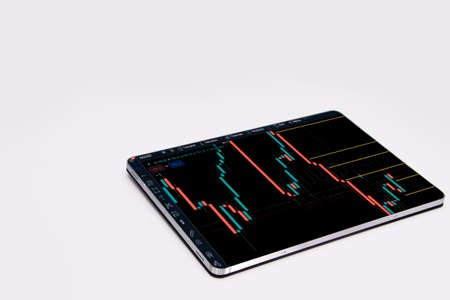
Financial stock market graph on the tablet screen on cement background. Top view. Stock Exchange.
Коллекция по умолчанию
Коллекция по умолчанию
Создать новую
Stock Market Chart on Blue Background. share drop down and stock up
Коллекция по умолчанию
Коллекция по умолчанию
Создать новую
Business statistics and Analytics value . Abstract glowing forex chart interface background. Investment, trade, stock, finance and analysis concept.
Коллекция по умолчанию
Коллекция по умолчанию
Создать новую
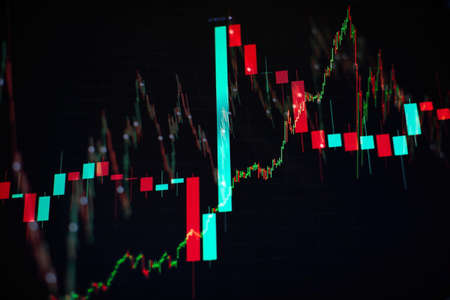
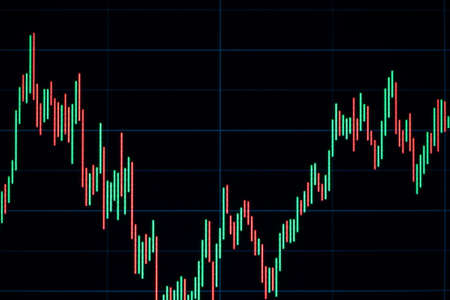
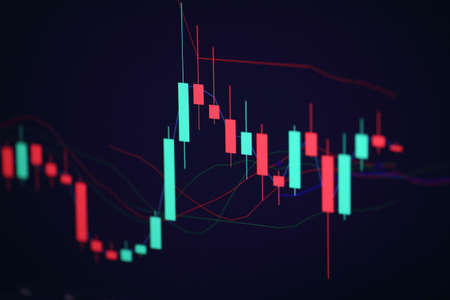
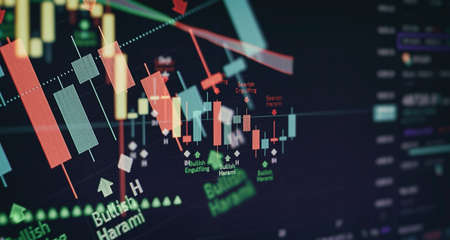
Business graph. Bullish Bearish trend. Candlestick chart uptrend downtrend . Stock trade on online market forex.
Коллекция по умолчанию
Коллекция по умолчанию
Создать новую
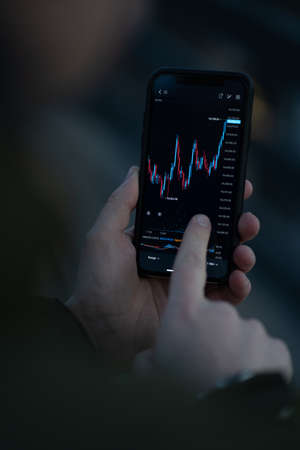
A trader investor analyzes candlestick charts of stocks, crypto currencies in a smartphone application. Trading, investing and technical analysis concept. Close-up of a smartphone screen. 4k
Коллекция по умолчанию
Коллекция по умолчанию
Создать новую

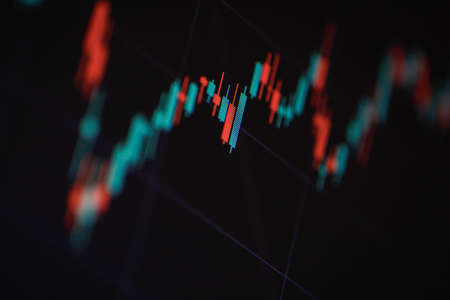
Shallow depth of field (selective focus) with details of a candlestick chart on a computer screen.
Коллекция по умолчанию
Коллекция по умолчанию
Создать новую
Our profits are on the rise. Shot of paperwork and stationery on a desk in an empty office during the day.
Коллекция по умолчанию
Коллекция по умолчанию
Создать новую
Economic graphic. Financial chart, stock analysis data for business background in digital screen. Graphics growth forex finance market. Stock analyzing. Price chart bars
Коллекция по умолчанию
Коллекция по умолчанию
Создать новую
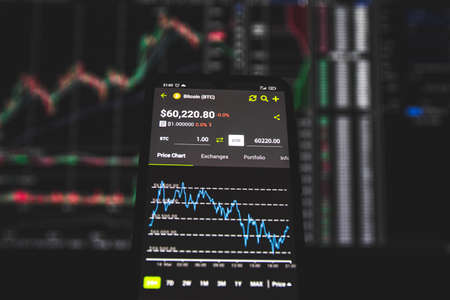
Cryptocurrency exchange chart. Bitcoin price goes up to 60 000 dollars. Blockchain and digital money
Коллекция по умолчанию
Коллекция по умолчанию
Создать новую

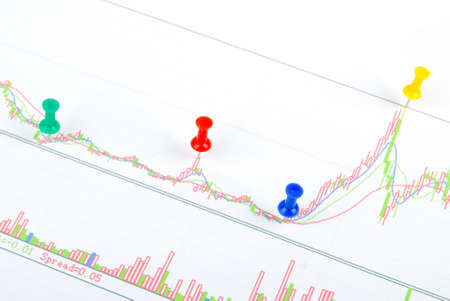
close up of pin and hand drawn business strategy graph chart on sticky note with cork board as concept
Коллекция по умолчанию
Коллекция по умолчанию
Создать новую
A stock market graph on a black background.
Коллекция по умолчанию
Коллекция по умолчанию
Создать новую
Change the stock market chart. The fall in the value of cryptocurrencies. Brokerage data
Коллекция по умолчанию
Коллекция по умолчанию
Создать новую
Close up businessman working with computer laptop.
Коллекция по умолчанию
Коллекция по умолчанию
Создать новую
Trading forex with METATRADER 4 on Apple iPad Pro 11 inch. iPad Pro is the most user friendly which good for people on the go.
Коллекция по умолчанию
Коллекция по умолчанию
Создать новую
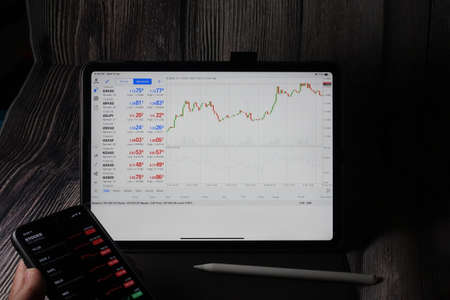
Trading forex with METATRADER 4 on Apple iPad Pro 11 inch. iPad Pro is the most user friendly which good for people on the go.
Коллекция по умолчанию
Коллекция по умолчанию
Создать новую
A detailed line graph shows financial trends marked by an upward movement, reflecting analysis of data for improved decision-making processes.
Коллекция по умолчанию
Коллекция по умолчанию
Создать новую
Financial chart with uptrend line close-up, stock market on the screen, business background photo
Коллекция по умолчанию
Коллекция по умолчанию
Создать новую
Stockmarket diagram and grah on displayscreen
Коллекция по умолчанию
Коллекция по умолчанию
Создать новую
Business concept
Коллекция по умолчанию
Коллекция по умолчанию
Создать новую

Shallow depth of field (selective focus) with details of a candlestick chart on a computer screen.
Коллекция по умолчанию
Коллекция по умолчанию
Создать новую

A statistical report with a diagram lies on the table
Коллекция по умолчанию
Коллекция по умолчанию
Создать новую
Financial stock market graph. Stock Exchange. Selective focus.
Коллекция по умолчанию
Коллекция по умолчанию
Создать новую
graph with diagrams on the stock market, for business and financial concepts and reports.Abstract blue background.
Коллекция по умолчанию
Коллекция по умолчанию
Создать новую
Learn online, Student watching lesson online and studying from home. Young man taking notes while looking at computer screen following professor on video call. Studying from home on pc.
Коллекция по умолчанию
Коллекция по умолчанию
Создать новую
stock indexes in virtual space. Economic growth, recession. Electronic virtual platform showing trends and stock market fluctuations
Коллекция по умолчанию
Коллекция по умолчанию
Создать новую
Trader checking stock market data in mobile app for trading online. Male hand touching smartphone screen with real time forex chart, reading financial news and analyzing price flow, selective focus
Коллекция по умолчанию
Коллекция по умолчанию
Создать новую

Stock market graph on screen. Ticker on monitor screen. Investing, Finance and Economic concept. Shallow depth of field.
Коллекция по умолчанию
Коллекция по умолчанию
Создать новую

Stock exchange chart on smartphone screen, bell and hundred dollar bills blue background.Concept, stocks, business and finance
Коллекция по умолчанию
Коллекция по умолчанию
Создать новую

Broadcom stock price on the screen of mobile phone in mans hand with changing stock market graphs on the background, February 2022, San Francisco, USA.
Коллекция по умолчанию
Коллекция по умолчанию
Создать новую

Invest investor. Finance application for sell, buy and analysis profit dividend statistics. Investment business technology app on digital screen. Global currency background
Коллекция по умолчанию
Коллекция по умолчанию
Создать новую
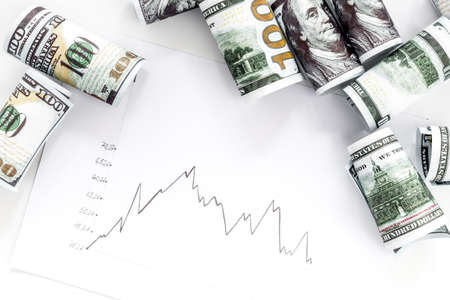
Stock market chart with US dollars banknote top view
Коллекция по умолчанию
Коллекция по умолчанию
Создать новую
a mahout ride elephant, Chiang Mai, Thailand
Коллекция по умолчанию
Коллекция по умолчанию
Создать новую
The business plan at the meeting and analyze financial numbers to view the performance of the company.
Коллекция по умолчанию
Коллекция по умолчанию
Создать новую
Business or Financial Reference: Displaying stock market data, stock exchange or chart on a monitor, stock market chart, stock exchange or chart. stock market investment trading chart.
Коллекция по умолчанию
Коллекция по умолчанию
Создать новую
Closeup side view of woman hand holding analyzing graphs and diagrams, statistic. Indoor studio shot isolated on yellow background.
Коллекция по умолчанию
Коллекция по умолчанию
Создать новую

stock chart image displayed on computer screen
Коллекция по умолчанию
Коллекция по умолчанию
Создать новую
business analysis and statistics concept, desk with mixed graphs and charts on notebooks
Коллекция по умолчанию
Коллекция по умолчанию
Создать новую
Stock Market Loss Trading Chart Investment Analysis Business Index Chart Finance Board Chart
Коллекция по умолчанию
Коллекция по умолчанию
Создать новую
Currency rates and chart for forex trading
Коллекция по умолчанию
Коллекция по умолчанию
Создать новую
Business and trading finance contept. Stock exchange market chart view on smart phone screen.
Коллекция по умолчанию
Коллекция по умолчанию
Создать новую
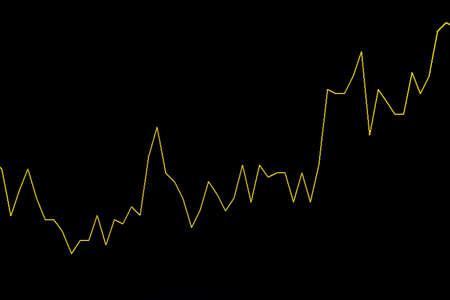
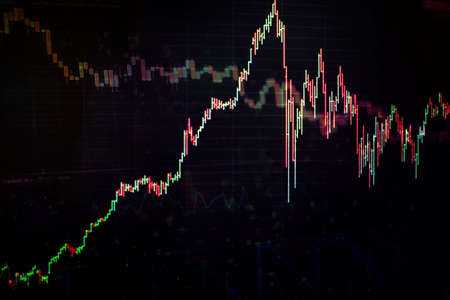
Continuous Uptrend Yellow Stock Chart or Forex Chart on Black Background
Коллекция по умолчанию
Коллекция по умолчанию
Создать новую
Stock market or forex trading graph and candlestick chart suitable for financial investment concept. Abstract finance background.
Коллекция по умолчанию
Коллекция по умолчанию
Создать новую
Forex chart displayed on the monitor
Коллекция по умолчанию
Коллекция по умолчанию
Создать новую

Stock Chart Macro Concept 2
Коллекция по умолчанию
Коллекция по умолчанию
Создать новую
Shallow depth of field (selective focus) with details of a chart showing the stock market crash from March 2020 due to the Covid-19 pandemic on a computer screen (S&P500 index)
Коллекция по умолчанию
Коллекция по умолчанию
Создать новую
Bitcoin. Change the price on the display. Brokerage information, display of the price of the electronic means of payment
Коллекция по умолчанию
Коллекция по умолчанию
Создать новую
Sustainable portfolio management, long term wealth management with risk diversification concept.
Коллекция по умолчанию
Коллекция по умолчанию
Создать новую
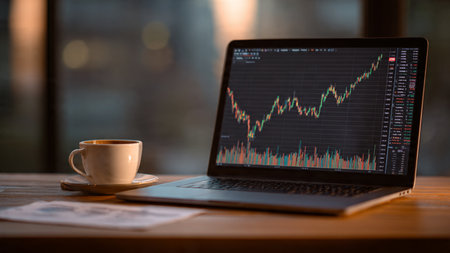
Organized trading workspace with laptop analytics and a fresh cup of cappuccino.
Коллекция по умолчанию
Коллекция по умолчанию
Создать новую
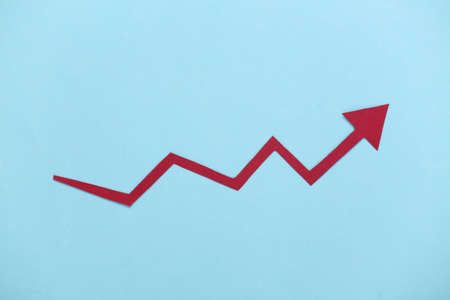
Red growth arrow on blue background. Arrow graph going up. The economic growth
Коллекция по умолчанию
Коллекция по умолчанию
Создать новую
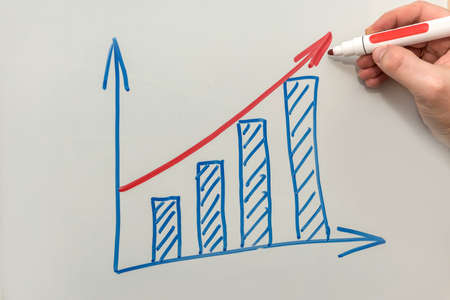
Hand drawing graph with blue marker. Businessman drawing magnifying arrows oven business graph. Grow.
Коллекция по умолчанию
Коллекция по умолчанию
Создать новую
Shallow depth of field (selective focus) with details of a chart showing the stock market crash from March 2020 due to the Covid-19 pandemic on a computer screen (S&P500 index)
Коллекция по умолчанию
Коллекция по умолчанию
Создать новую

Working set for analyzing financial statistics and analyzing a market data. Data analyzing from charts and graph to find out the result.
Коллекция по умолчанию
Коллекция по умолчанию
Создать новую
Shallow depth of field (selective focus) with details of a candlestick chart on a computer screen.
Коллекция по умолчанию
Коллекция по умолчанию
Создать новую
Close-up of a financial graph on a computer screen, showcasing upward and downward trends with detailed line and bar charts.
Коллекция по умолчанию
Коллекция по умолчанию
Создать новую
Business
Коллекция по умолчанию
Коллекция по умолчанию
Создать новую
Stock market chart. Graphics growth forex finance market on tablet screen. Financial chart, stock analysis data background. Business growth, progress or success concept
Коллекция по умолчанию
Коллекция по умолчанию
Создать новую
Thailand Stock Exchange, Trading screen, Stock market.
Коллекция по умолчанию
Коллекция по умолчанию
Создать новую
Digital Finance: Analyzing Volatile Market Graphs and Managing Tiered Compensation Schedules on a Desktop.
Коллекция по умолчанию
Коллекция по умолчанию
Создать новую
Business Objects in the office on the table.
Коллекция по умолчанию
Коллекция по умолчанию
Создать новую
graph paper showing business information, Business graph analysis concept
Коллекция по умолчанию
Коллекция по умолчанию
Создать новую
A close-up financial chart with an uptrend line candle chart on the stock or cryptocurrency market on a black monitor background. Investment chart of the stock or cryptocurrency market with indicators
Коллекция по умолчанию
Коллекция по умолчанию
Создать новую
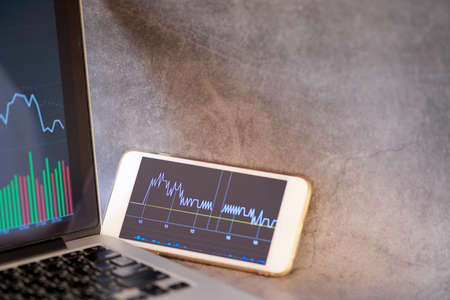
Stock graph analysis in smartphone screen and laptop with copy space at right for text
Коллекция по умолчанию
Коллекция по умолчанию
Создать новую
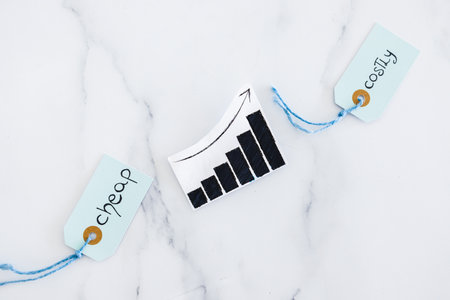
graph showing cost of living going up next to price tags of products going from cheap to costly, inlfation and recession concept after the pandemic
Коллекция по умолчанию
Коллекция по умолчанию
Создать новую

Follow stock prices, stock quotes and the rise and fall of the cryptocurrency on a mobile tablet. The hand draws on the tablet screen using a stylus. close-up small depth of field
Коллекция по умолчанию
Коллекция по умолчанию
Создать новую
Economic graph with diagrams on the stock market, for business and financial concepts and reports.
Коллекция по умолчанию
Коллекция по умолчанию
Создать новую
Economic graph with diagrams on the stock market, for business and financial concepts
Коллекция по умолчанию
Коллекция по умолчанию
Создать новую
Candlestick chart showing upward trend, representing growth and success in financial markets, against a colorful digital grid background
Коллекция по умолчанию
Коллекция по умолчанию
Создать новую

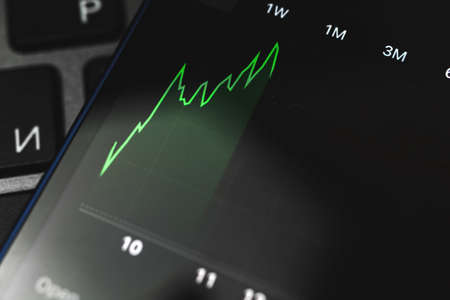
Currency growth chart online. Phone with a schedule. financial concept. 3d rendering.
Коллекция по умолчанию
Коллекция по умолчанию
Создать новую
Abstract graphic consisting of blurred points , graph and chart . information concept.
Коллекция по умолчанию
Коллекция по умолчанию
Создать новую
The business plan at the meeting and analyze financial numbers to view the performance of the company.
Коллекция по умолчанию
Коллекция по умолчанию
Создать новую

Wooden block statistics histogram with graph showing growth trend on blue paper background
Коллекция по умолчанию
Коллекция по умолчанию
Создать новую

The business plan at the meeting and analyze financial numbers to view the performance of the company.
Коллекция по умолчанию
Коллекция по умолчанию
Создать новую
Close-up of a business chart showing a rising trend line, symbolizing growth and progress in financial performance. Ideal for economic insights.
Коллекция по умолчанию
Коллекция по умолчанию
Создать новую
The Stock Exchange, Streaming Trade Screen, The stock screen Show the stock price rise.
Коллекция по умолчанию
Коллекция по умолчанию
Создать новую
Stock exchange market chart background. Candle stick graph chart with indicator.
Коллекция по умолчанию
Коллекция по умолчанию
Создать новую
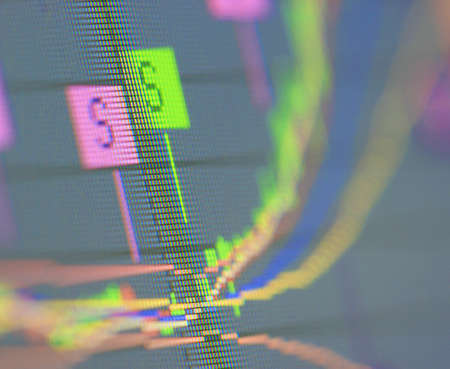
the curve on the screen
Коллекция по умолчанию
Коллекция по умолчанию
Создать новую
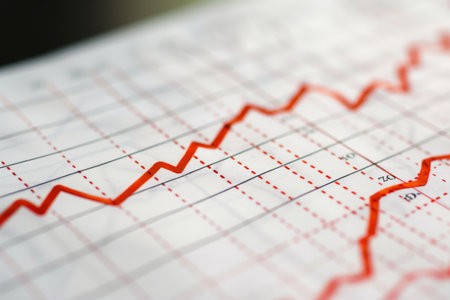
This image showcases a red trend line graph over a grid chart, symbolizing financial growth and data analysis in business environments.
Коллекция по умолчанию
Коллекция по умолчанию
Создать новую

Business and finance strategy. Data analytics for stock market investing.
Коллекция по умолчанию
Коллекция по умолчанию
Создать новую
Businessman hand working on analyzing investment charts for Gold market, Forex market and Trading market.
Коллекция по умолчанию
Коллекция по умолчанию
Создать новую
An office worker shows his colleagues a presentation with a company development graph at night on the company's computer
Коллекция по умолчанию
Коллекция по умолчанию
Создать новую
Abstract finance curve blue background Investment, marketing concept.Blurred background.
Коллекция по умолчанию
Коллекция по умолчанию
Создать новую
Business Information Technology people work hard Data Analytics Statistics
Коллекция по умолчанию
Коллекция по умолчанию
Создать новую

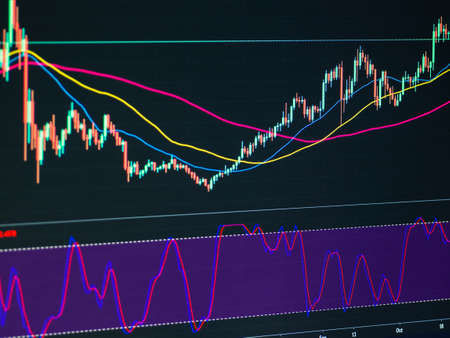
Stockmarket online trading chart candlestick on crypto currency platform. Stock exchange financial market price candles graph data pattern analysis concept. Computer screen closeup background
Коллекция по умолчанию
Коллекция по умолчанию
Создать новую
Daily trading prices stock market graph showing on the screen.Daily investor's business everyday life.Selective focus.Telsiai,Lithuania.03-26-2022
Коллекция по умолчанию
Коллекция по умолчанию
Создать новую
Abstract financial graph with candle stick and bar chart of stock market on financial background
Коллекция по умолчанию
Коллекция по умолчанию
Создать новую
Indicator, red and green candlestick chart on blue theme screen, market volatility, up and down trend. Stock trading, crypto currency background.
Коллекция по умолчанию
Коллекция по умолчанию
Создать новую
Display of quotes pricing graph visualization. Stock market graph and bar chart price display.
Коллекция по умолчанию
Коллекция по умолчанию
Создать новую
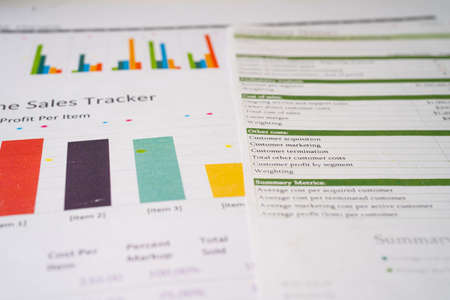
Charts Graphs paper. Financial development, Banking Account, Statistics, Investment Analytic research data economy, Stock exchange Business office company meeting concept.
Коллекция по умолчанию
Коллекция по умолчанию
Создать новую
Legion-Media
Создайте свои проекты на основе качественных стоковых фотографий и видео.


Copyright © Legion-Media.